Multiple Regression & Confonding

12
Author

Robin Donatello

Published

November 6, 2023

Setup

Code
library(tidyverse)   # general use
library(performance) # model diagnostics
library(gtsummary)   # regression tables
library(broom)       # tidy regression output

fev <- read.delim("https://norcalbiostat.netlify.com/data/Lung_081217.txt", sep="\t", header=TRUE)
load("C:/Box/Data/AddHealth/addhealth_clean.Rdata")
#load("C:/Users/rdonatello/Box/Data/AddHealth/addhealth_clean.Rdata")

Motivation

ggplot(fev, aes(y=FFEV1, x=FHEIGHT)) + geom_point() + 
      xlab("Height") + ylab("FEV1") + 
      ggtitle("Relationship between FEV1 and Height of Fathers.") + 
      geom_smooth(method="lm", se=FALSE, col="blue") + 
      geom_smooth(se=FALSE, col="red") + 
  theme_bw()
ggplot(fev, aes(y=FFEV1, x=FAGE)) + geom_point() + 
      xlab("Age") + ylab("FEV1") + 
      ggtitle("Relationship between FEV1 and Age of Fathers.") + 
      geom_smooth(method="lm", se=FALSE, col="blue") + 
      geom_smooth(se=FALSE, col="red") + 
  theme_bw()

  • There appears to be a tendency for taller men to have higher FEV1, but FEV1 also decreases with age.
  • We need to have a robust model that can incorporate information from multiple variables at the same time.

MLR Framework

  • Multiple linear regression is our tool to expand our MODEL to better fit the DATA.
  • Describes a linear relationship between a single continuous \(Y\) variable, and several \(X\) variables.
  • Models \(Y\) from \(X_{1}, X_{2}, \ldots , X_{P}\).
  • X’s can be continuous or discrete (categorical)
  • X’s can be transformations of other X’s, e.g., \(log(x), x^{2}\).

Visualization

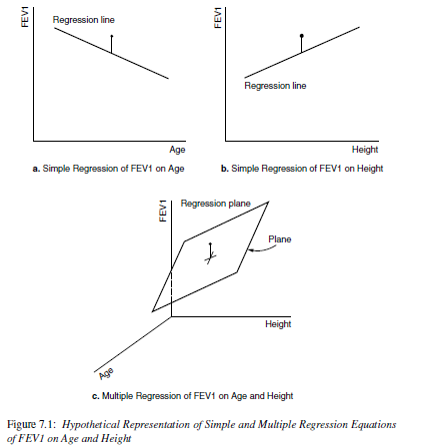
Now it’s no longer a 2D regression line, but a \(p\) dimensional regression plane.

A regression plane in 3 dimensions: \(FEV1 \sim Height + Age\)

Mathematical Model

The mathematical model for multiple linear regression equates the value of the continuous outcome \(y_{i}\) to a linear combination of multiple predictors \(x_{1} \ldots x_{p}\) each with their own slope coefficient \(\beta_{1} \ldots \beta_{p}\).

\[ y_{i} = \beta_{0} + \beta_{1}x_{1i} + \ldots + \beta_{p}x_{pi} + \epsilon_{i}\]

where \(i\) indexes the observations \(i = 1 \ldots n\), and \(j\) indexes the number of parameters \(j=1 \ldots p\).

Assumptions

The assumptions on the residuals \(\epsilon_{i}\) still hold:

  • They have mean zero
  • They are homoscedastic, that is all have the same finite variance: \(Var(\epsilon_{i})=\sigma^{2}<\infty\)
  • Distinct error terms are uncorrelated: (Independent) \(\text{Cov}(\epsilon_{i},\epsilon_{j})=0,\forall i\neq j.\)

Parameter Estimation

Find the values of \(b_j\) that minimize the difference between the value of the dependent variable predicted by the model \(\hat{y}_{i}\) and the true value of the dependent variable \(y_{i}\).

\[ \hat{y_{i}} - y_{i}\]

where the predicted values \(\hat{y}_{i}\) are calculated as

\[\hat{y}_{i} = \sum_{i=1}^{p}X_{ij}b_{j}\]

Minimize:

\[ \sum_{i=1}^{n} (y_{i} - \sum_{i=1}^{p}X_{ij}b_{j})^{2}\]

Fitting the model

Fitting a regression model in R with more than 1 predictor is done by adding each variable to the right hand side of the model notation connected with a +.

lm(FFEV1 ~ FAGE + FHEIGHT, data=fev)

Call:
lm(formula = FFEV1 ~ FAGE + FHEIGHT, data = fev)

Coefficients:
(Intercept)         FAGE      FHEIGHT  
   -2.76075     -0.02664      0.11440  
  • Each \(\beta_{j}\) coefficient is considered a slope. The amount \(Y\) will change for every 1 unit increase in \(X_{j}\).
  • In a multiple variable regression model, \(b_{j}\) is the estimated change in \(Y\) after controlling for other predictors in the model.

Interpreting Coefficients

mlr.dad.model <- lm(FFEV1 ~ FAGE + FHEIGHT, data=fev)
tidy(mlr.dad.model)
# A tibble: 3 × 5
  term        estimate std.error statistic  p.value
  <chr>          <dbl>     <dbl>     <dbl>    <dbl>
1 (Intercept)  -2.76     1.14        -2.43 1.65e- 2
2 FAGE         -0.0266   0.00637     -4.18 4.93e- 5
3 FHEIGHT       0.114    0.0158       7.25 2.25e-11
confint(mlr.dad.model)
                  2.5 %      97.5 %
(Intercept) -5.00919751 -0.51229620
FAGE        -0.03922545 -0.01405323
FHEIGHT      0.08319434  0.14559974
  • Holding height constant, a father who is ten years older is expected to have a FEV value 0.27 (0.14, 0.39) liters less than another man (p<.0001).
  • Holding age constant, a father who is 1cm taller than another man is expected to have a FEV value of 0.11 (.08, 0.15) liter greater than the other man (p<.0001).

Confounding

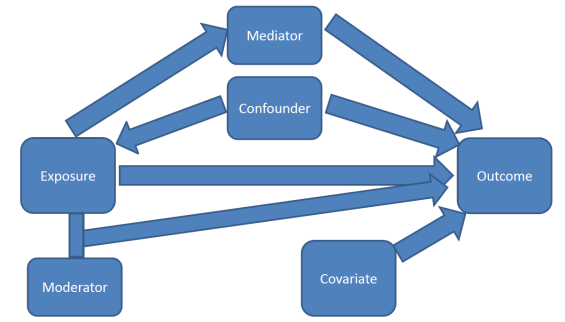
All the ways covariates can affect response variables

Confounding

Other factors (characteristics/variables) could also be explaining part of the variability seen in \(y\).

If the relationship between \(x_{1}\) and \(y\) is bivariately significant, but then no longer significant once \(x_{2}\) has been added to the model, then \(x_{2}\) is said to explain, or confound, the relationship between \(x_{1}\) and \(y\).

Identifying a confounder

  1. Fit a regression model on \(y \sim x_{1}\).
  2. If \(x_{1}\) is not significantly associated with \(y\), STOP. Re-read the “IF” part of the definition of a confounder.
  3. Fit a regression model on \(y \sim x_{1} + x_{2}\).
  4. Look at the p-value for \(x_{1}\). One of two things will have happened.
    • If \(x_{1}\) is still significant, then \(x_{2}\) does NOT confound (or explain) the relationship between \(y\) and \(x_{1}\).
    • If \(x_{1}\) is NO LONGER significantly associated with \(y\), then \(x_{2}\) IS a confounder.

This means that the third variable is explaining the relationship between the explanatory variable and the response variable.

Example: Does the early bird get the worm?

1. Identify variables

  • Quantitative outcome: Income (variable income).
  • Quantitative predictor: Time you wake up in the morning (variable wakeup)
  • Binary confounder: Gender (variable female_c). This variable is 1 if female, 0 if male.

2. State hypotheses

  • Null: There is no relationship between the time you wake up and your personal earnings
    • \(y \sim \beta_{0} + \beta_{1}x_{1}, \qquad H_{0}: \beta_{1}=0\)
  • Alternative: There is a relationship between the time you wake up and your personal earnings
    • \(y \sim \beta_{0} + \beta_{1}x_{1}, \qquad H_{0}: \beta_{1} \neq 0\)
  • Confounder: There is still a relationship between the time you wake up and your personal earnings, after controlling for gender.
    • \(y \sim \beta_{0} + \beta_{1}x_{1} + \beta_{2}x_{2}, \qquad H_{0}: \beta_{1} \neq 0\)

3. Visualize and Assess

addhealth %>% select(wakeup, income, female_c) %>% na.omit() %>%
  ggplot(aes(x=wakeup, y = income, color = female_c)) + 
  geom_point() + geom_smooth() + theme_bw()

Flat, somewhat linear trend, looks slightly different for males vs females, before 11am.

4. Fit the simple model

Is there a relationship between income and time a person wakes up?

lm.mod1 <- lm(income ~ wakeup, data=addhealth) 
tidy(lm.mod1)
# A tibble: 2 × 5
  term        estimate std.error statistic   p.value
  <chr>          <dbl>     <dbl>     <dbl>     <dbl>
1 (Intercept)   43548.     1126.     38.7  3.03e-276
2 wakeup         -488.      151.     -3.22 1.27e-  3

The estimate of the regression coefficient for wakeup is significant (b1=-488, p= 0.001). There is reason to believe that the time you wakeup is associated with your income.

5. Fit the multivariable model

Determine if the third variable is a confounder.

lm.mod2 <- lm(income ~ wakeup + female_c, data=addhealth) 
tidy(lm.mod2)
# A tibble: 3 × 5
  term           estimate std.error statistic   p.value
  <chr>             <dbl>     <dbl>     <dbl>     <dbl>
1 (Intercept)      48669.     1207.     40.3  2.06e-296
2 wakeup            -611.      149.     -4.09 4.37e-  5
3 female_cFemale   -8527.      789.    -10.8  8.09e- 27

The relationship between income and wake up time is still significant after controlling for gender. Gender is not a confounder.

6. Assess model fit

check_model(lm.mod2)

6. Assess model fit

This model doesn’t fit the data incredibly well.

  • The residuals are somewhat not normal
  • predicted income higher than the observed.
  • There is indication of non-constant variance as well,
  • Quadratic trend to the standardized residuals when the fitted income is above 40k.

7. Interpret the coefficients

tbl_regression(lm.mod2, intercept = TRUE) %>% 
   add_glance_table(include = c(adj.r.squared))
Characteristic Beta 95% CI1 p-value
(Intercept) 48,669 46,303, 51,036 <0.001
wakeup -611 -904, -318 <0.001
female_c
Male
Female -8,527 -10,075, -6,980 <0.001
Adjusted R² 0.032
1 CI = Confidence Interval
  • \(b_{0}\): For a male (gender=0) who wakes up at midnight (wakeup=0), their predicted average income is $48,669.4 (95% CI $46,303.9, $51,035)
  • \(b_{1}\): Holding gender constant, for every hour later a person wakes up, their predicted average income drops by $611 (95% CI $319, $904).
  • \(b_{2}\): Controlling for the time someone wakes up in the morning, the predicted average income for females is $8,527 (95% CI $6,980, $10,074) lower than for males.

8. Write a conclusion

After adjusting for the potential confounding factor of gender, wake up time (\(b_{1}\) = -611, 95% CI: (-904, -318), p<.0001) was significantly and negatively associated with income. Approximately 3.2% of the variance of income can be accounted for by wake up time after controlling for gender. Based on these analyses, gender is not a confounding factor because the association between wake up time and income is still significant after accounting for gender.