Workflows for Reproducibility
2025-09-08
Example Workflow
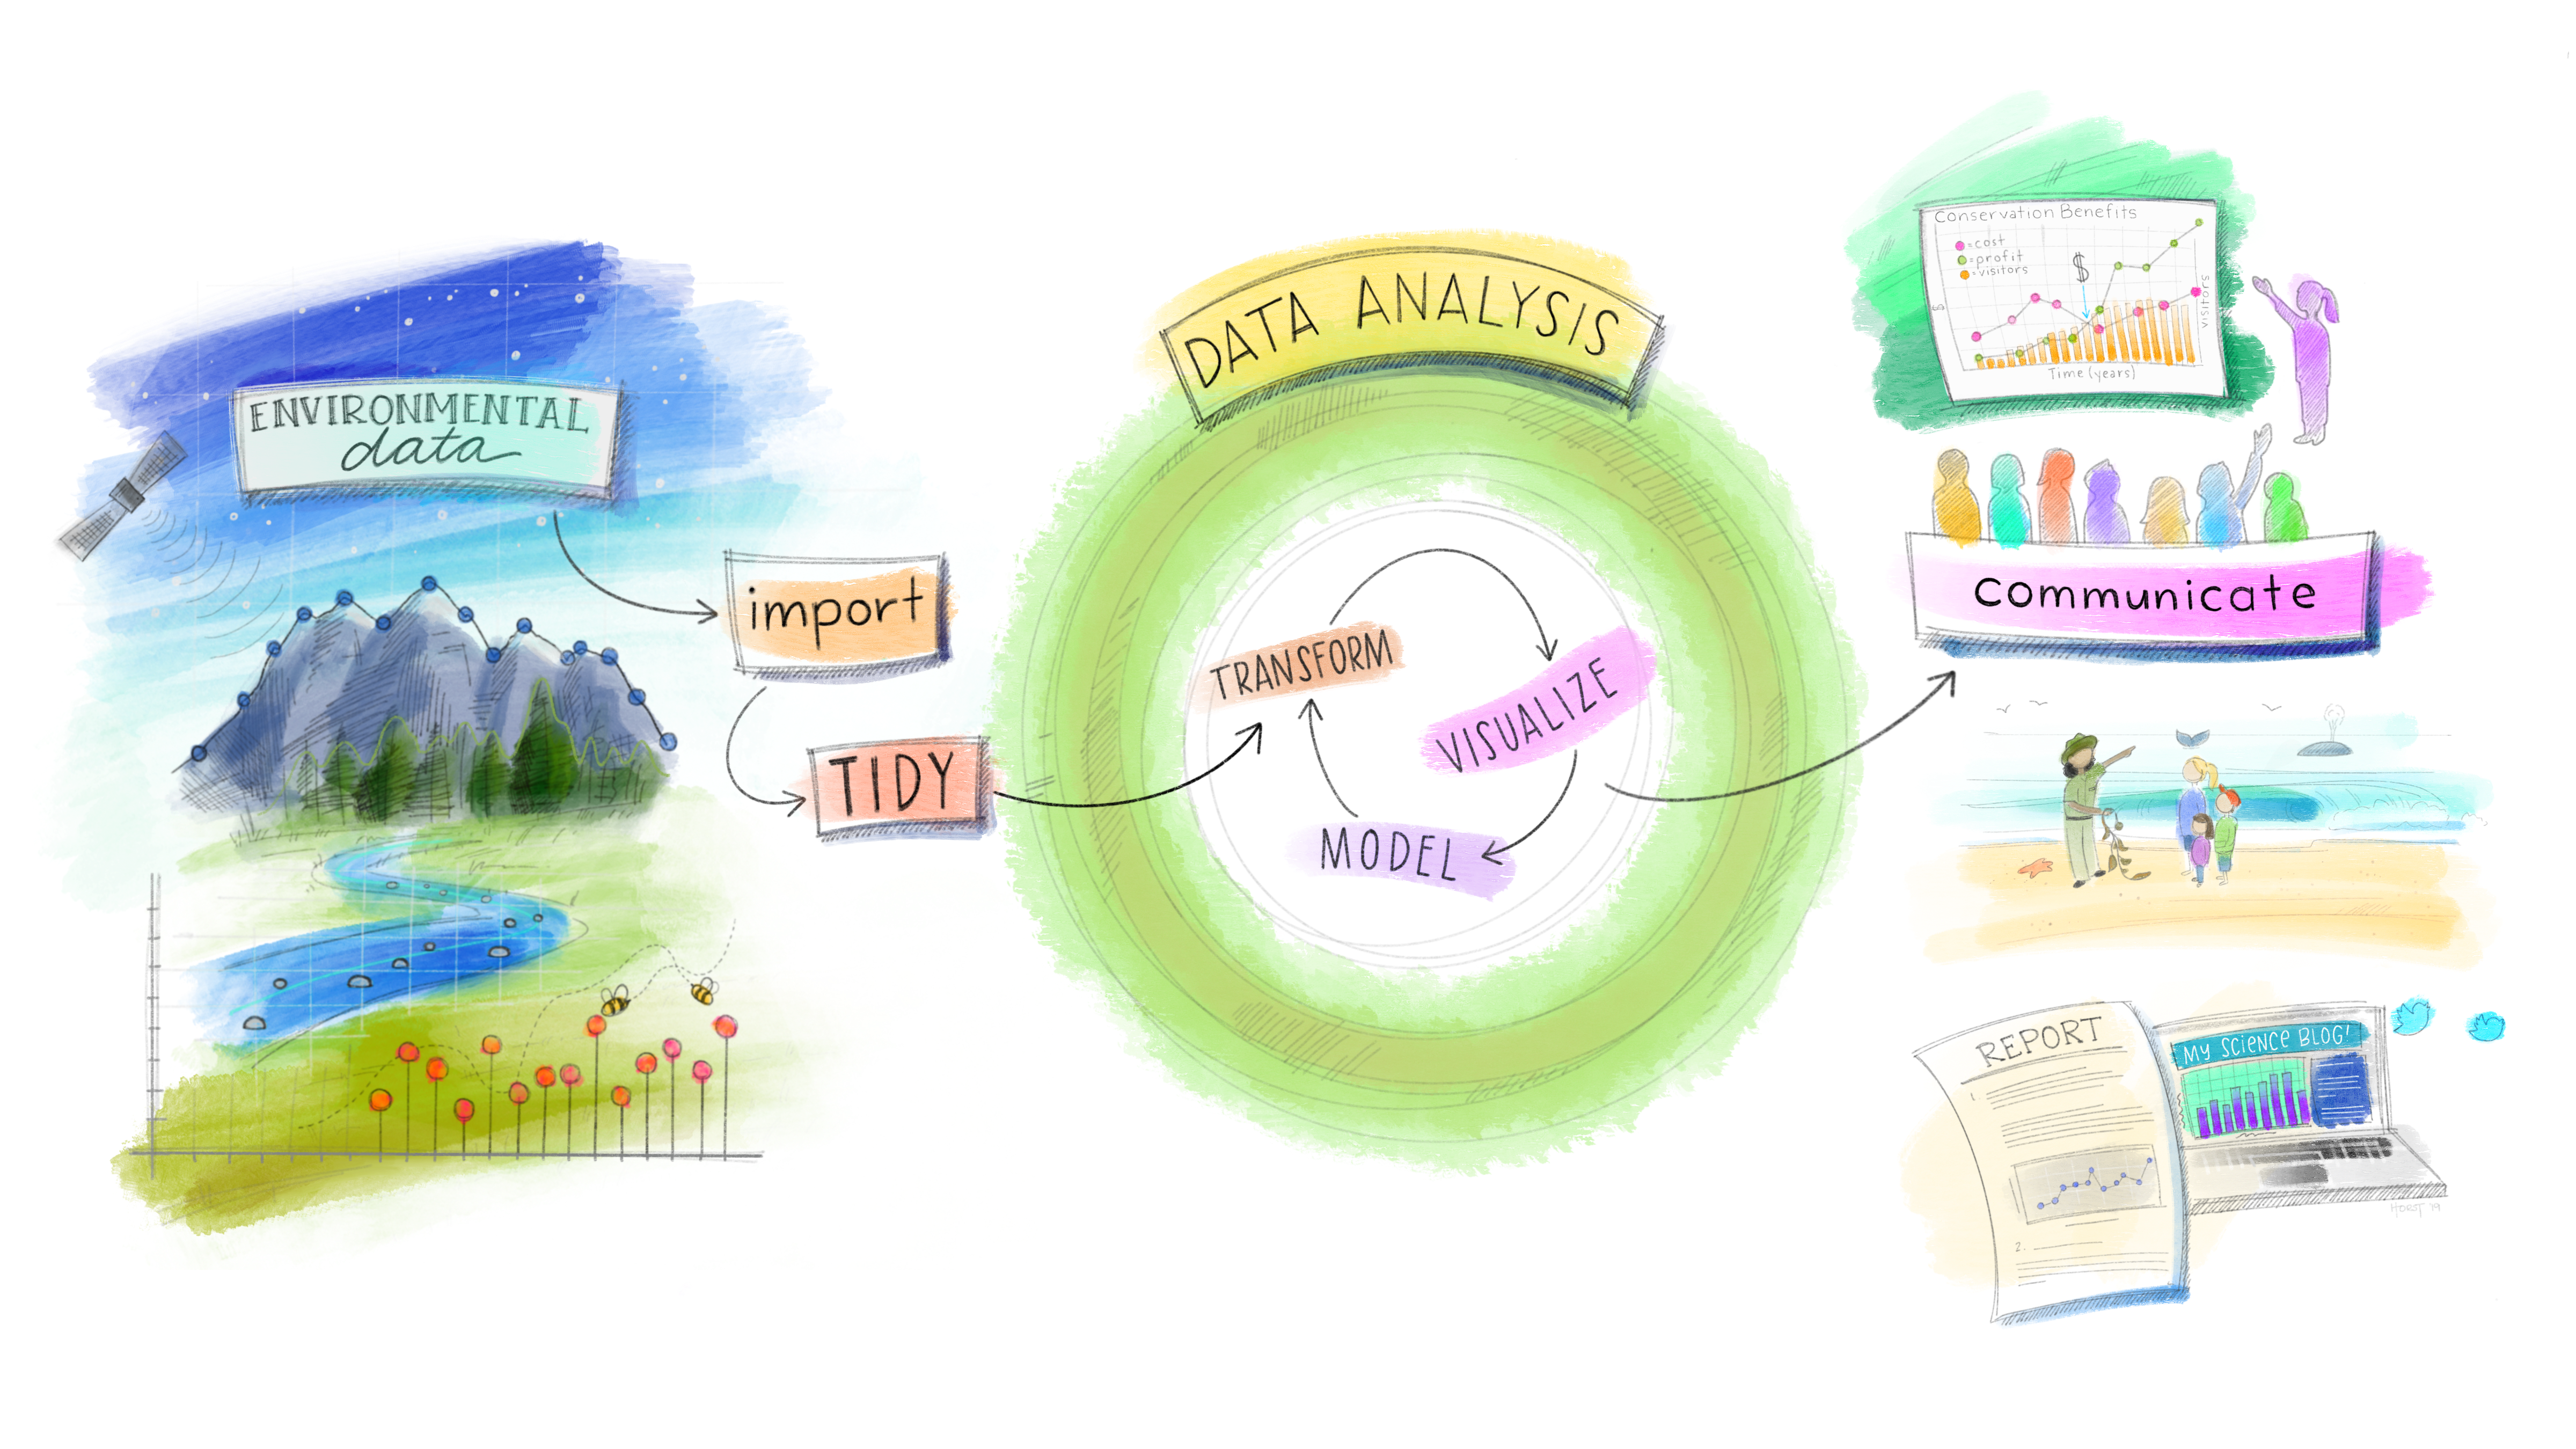
Fig ref: Updated from Grolemund & Wickham’s classis R4DS schematic, envisioned by Dr. Julia Lowndes for her 2019 useR! keynote talk and illustrated by Allison Horst.
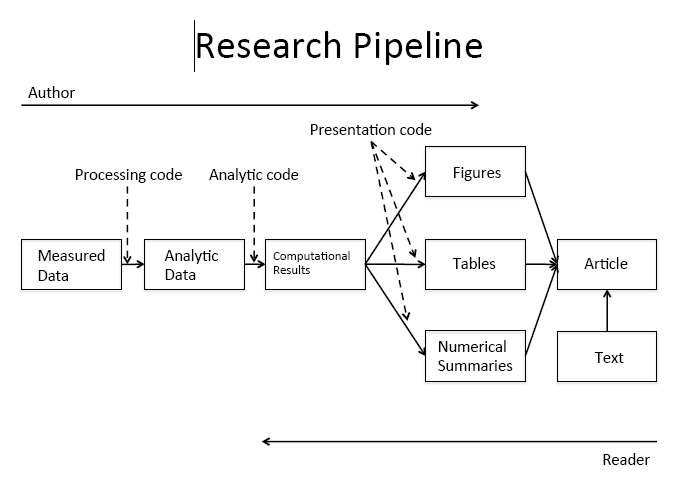
Figure Credits: Roger Peng
Data Analysis Pipeline

In this model of the data science process, you start with data import and tidying. Next, you understand your data with an iterative cycle of transforming, visualizing, and modeling. You finish the process by communicating your results to other humans. Ref R for Data Science 2nd ed
Regardless of the programming language you choose to use, using scripts will make this process reproducible and more powerful with less pain points.
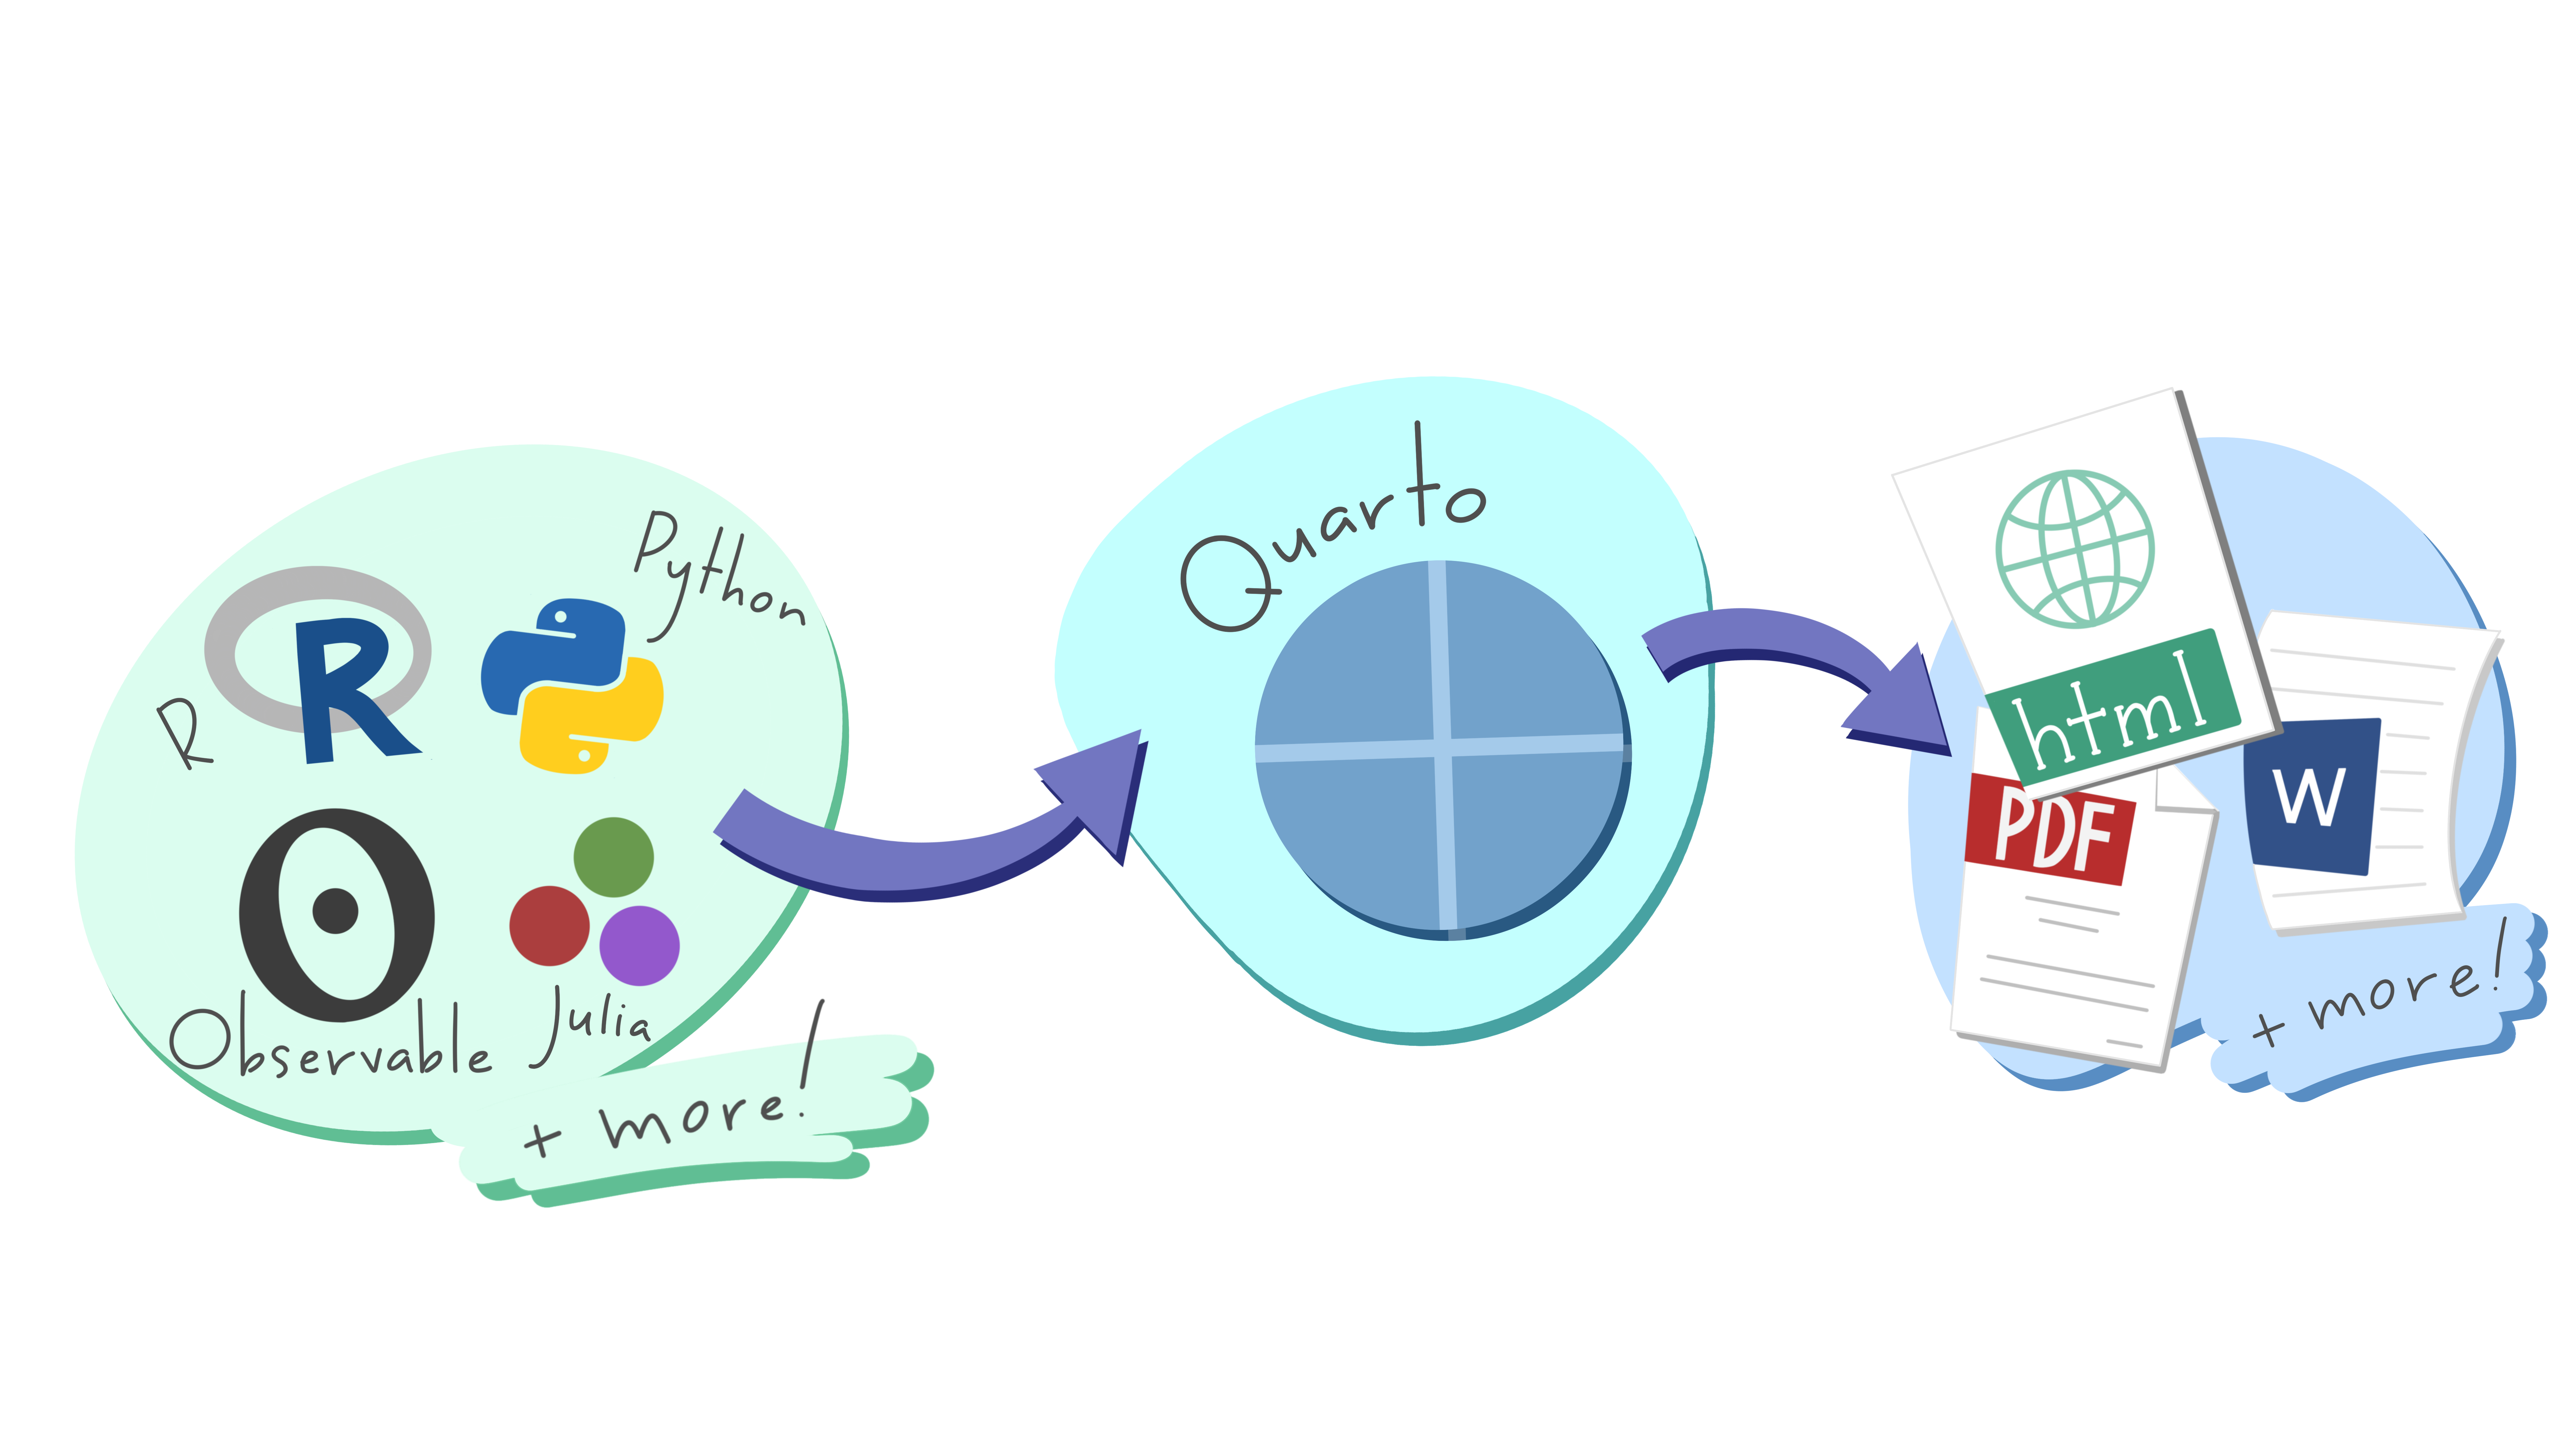
Quarto as an end-to-end solution
- “Next Generation” R Markdown
- Publish reproducible, production quality articles, presentations, dashboards, websites, blogs, and books in HTML, PDF, MS Word, ePub, and more.
- Write using Pandoc markdown, including equations, citations, crossrefs, figure panels, callouts, advanced layout, and more.